How Do I View My Instocks in Retail Link?
Learn about:
- How to pull your current instocks report
- How to pull your historic instocks report
- The results of these reports
Keeping track of your store instock levels is one of the most important parts of managing your Walmart business. Forecasts and supply chain execution are major drivers for keeping stores instock, but how do you actually determine your store instock levels? What level of detail is available in Retail Link?
This article will detail several ways to see store instocks at the item level, store level, and even historic weekly instock levels.
Before diving into the different applications and report templates, it’s important to note the difference between the various instock metrics.
- Instock % – This metric looks at which valid stores have at least one unit on hand. This metric does not consider forecasted demand, so it is not an adequate metric to determine whether a store has sufficient inventory.
- Replenishment Instock % – This is the most common instock metric. Replenishment Instock % looks at replenishable (valid) stores and compares store inventory to forecasted daily demand to determine if a store has sufficient inventory to cover forecasted customer demand.
- Customer Instock % – Rarely used, this metric looks at which stores, both valid and invalid, stores have at least one unit on hand.
There are various ways to determine your store instock levels. We are going to concentrate on the most popular method: Decision Support System (DSS) Custom Queries.
Related Reading: Replenishment 101: What Is Replenishment?
Decision Support Custom Queries
Decision Support allows the user to build custom queries, as the name suggests. Suppliers can define specific criteria in a database query, returning exactly the data they need to see.
For instock purposes, the supplier can view instock in two ways: current and historic. We are going to build both queries in this lesson.
Current Instock
Within any DSS report template, any Report Column with the abbreviation “Curr” means current, or as of the previous evening. This means that a column selection of “Curr Str On Hand Qty” will show inventory physically on hand at the stores as of the previous evening.
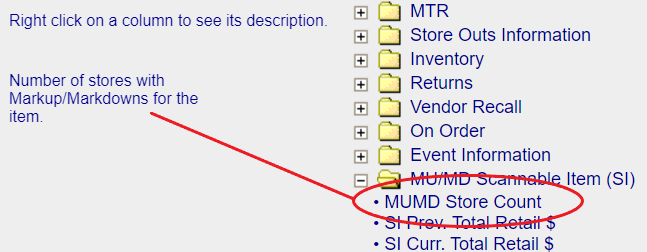
Tip: Many of the Report Column names in Decision Support are difficult to define. Fortunately, DSS provides an option to help define the purpose of each Report Column. Users can right-click on any column and see a definition of the metric in the left sidebar.
To build an item-level instock report, the easiest way is to use the Company Summary report template. This template can be found in the Sales and Margin folder in DSS. Click on Company Summary to open the Report Wizard.
In the Columns tab, select the report columns in the following screenshot. Remember, you can right-click on any Report Column to see a brief description of that selection. If you are unsure in which folder a column is, use the Search feature at the top of the report columns list.
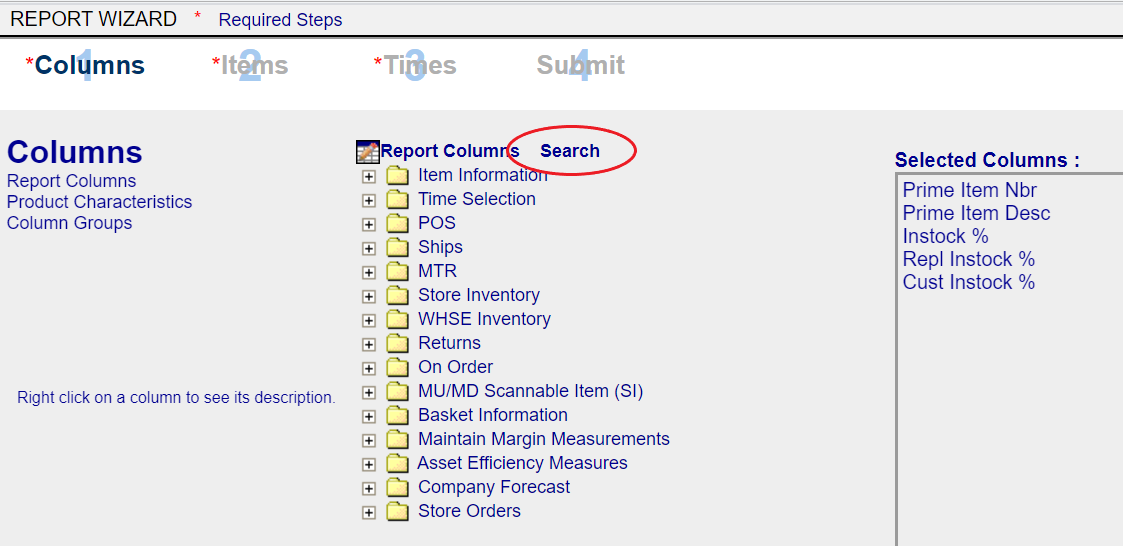
DSS Report Wizard – Columns tab for current instocks
Columns to select:
- Prime Item Nbr
- Prime Item Desc
- Instock %
- Repl Instock %
- Cust Instock %
On the Items tab, we define the “pool of data” for our query. In our report, we are going to ask DSS to return every item associated with our 6-digit supplier number. You can use different Item filters based on your specific needs.
Use the following screenshot as a guide for the Items tab selections.
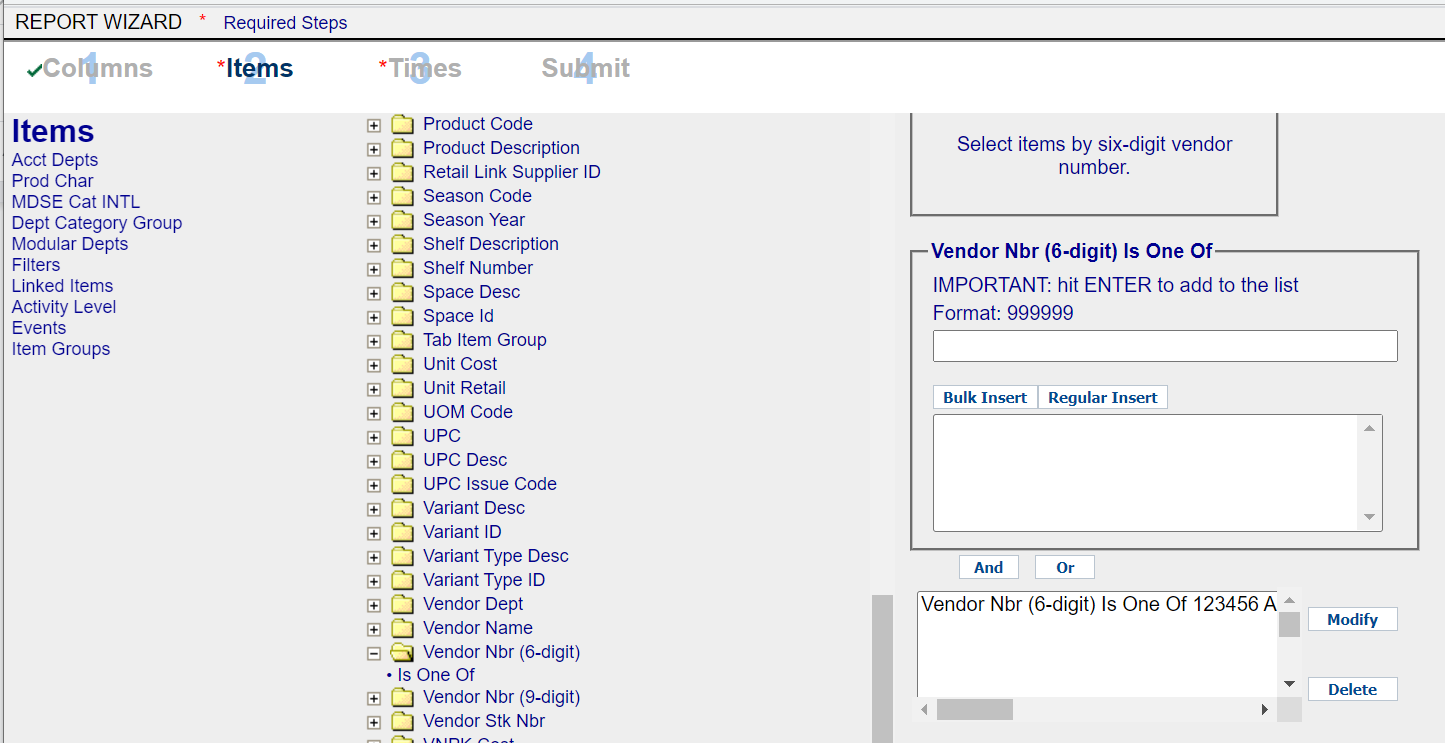
DSS Report Wizard – Items tab for historic instocks
Select Vendo Nbr (6-digit) Is One Of and add your six-digit item number.
The Times tab is where you can define the time range for this report. Since we are only interested in a current snapshot, the time range selection is irrelevant. The instock metrics we selected on the Columns tab will return data from the previous evening regardless of the time range selected.
Use the following screenshot as a guide for the Times tab selections.
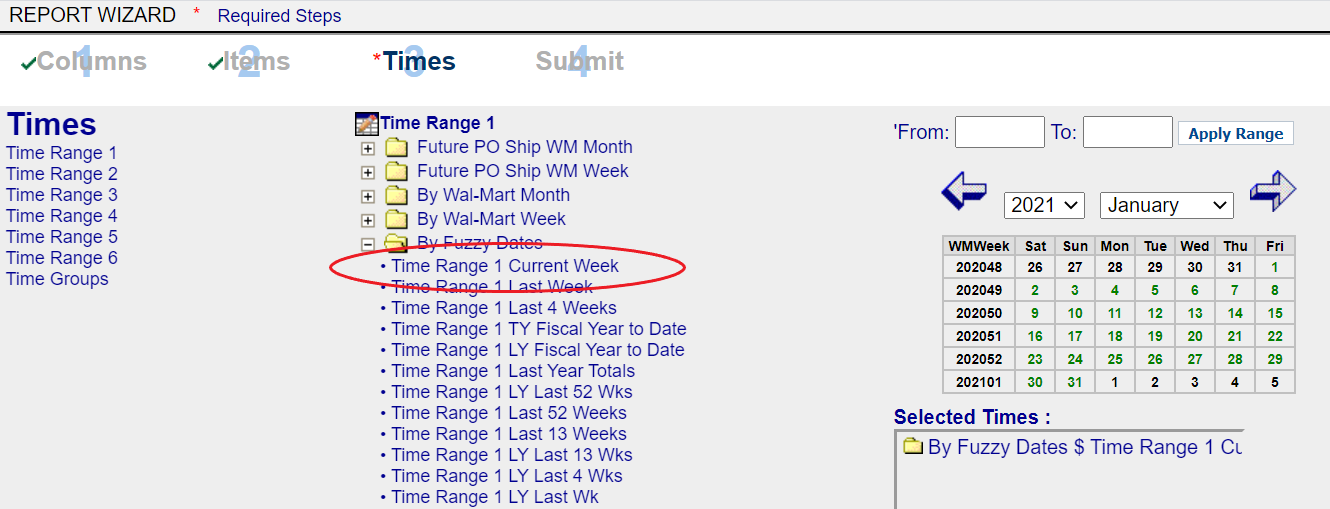
DSS Report Wizard – Times tab for current instocks
Times to select:
- By Fuzzy Dates
- Time Range 1 Current Week
The Submit tab is where you can name, run, save, and schedule this report.
- Title – The heading that appears above the data results in the Excel document.
- Run Now – Tells DSS to submit the request to the database for processing. In essence, “Go get the specific data I asked for in this query.”
- Save – Adds this report template to My Reports for use in the future.
- Schedule – Instructs DSS to run this report on a recurring basis (weekly, monthly, quarterly, etc).
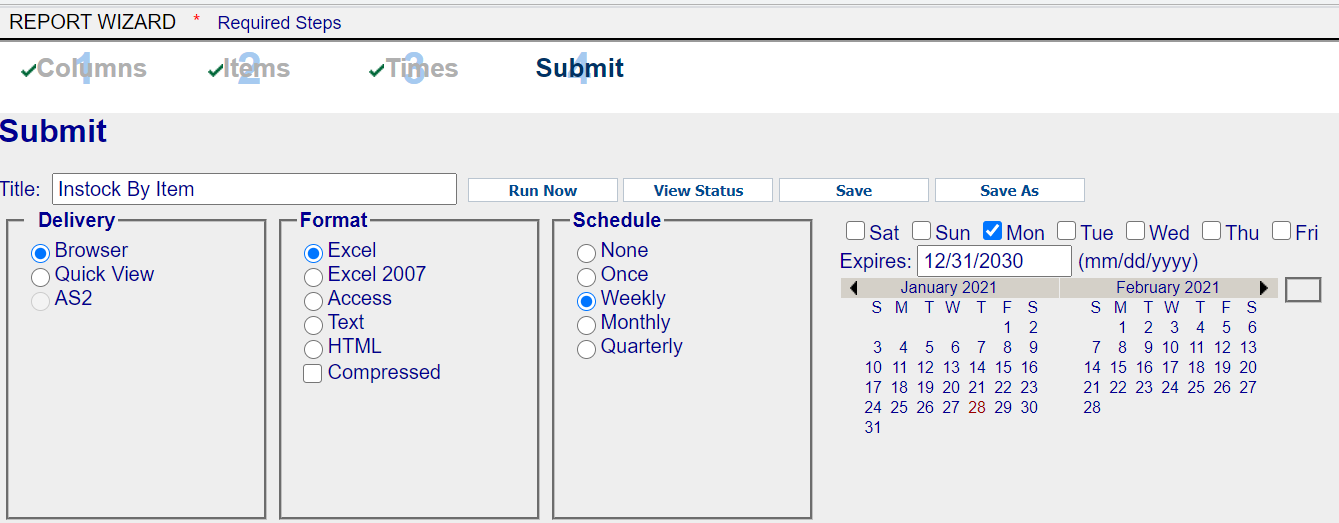
DSS Report Wizard – Submit tab for current instocks
The Results of the Current Instock Report
Once downloaded, the Excel sheet should look similar to the screenshot below. You’ll notice the three distinct instock metrics, as defined earlier. This data updated the previous evening.
Note: Since we opted to run this report using our 6-digit vendor number, the query returns every item associated with this contract – including items that might not be currently selling in Walmart stores. Any items with 0% for the instock metrics are not active and you can disregard them.
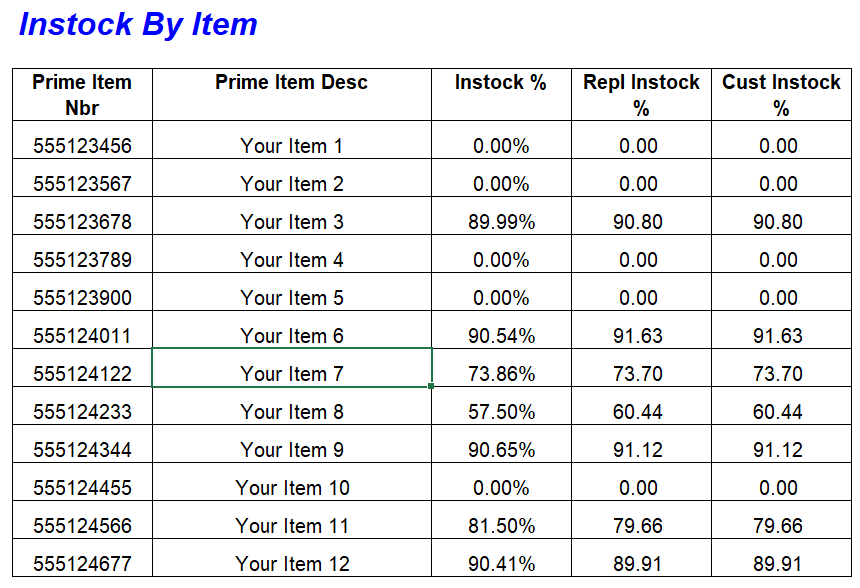
Instock by Item – Excel report
Related Reading: Replenishment 201: Monitoring Store-Level Inventory
Historic Instock
The previous report resulted in a snapshot of the current instock position for your items. This data is useful to see what is going on now, but what if you are looking at historic sales and notice an abnormality in the sales data? In such an instance, it would be useful to see what the instock situation was then.
Fortunately, DSS allows users to view historic performance metrics with just a few changes to the previous report.
Select the report columns in the following screenshot. You will notice the addition of the Time Selection selections. This is the key to instructing DSS to return historical data, not just a snapshot of last night. The selections you should make here are:
- Time Across Data Across – this instructs DSS to dedicate a column to each time increment
- WM Week – this defines the increment. In this case, DSS will return the metric we selected (instock) for each week in the Time Range we select later.
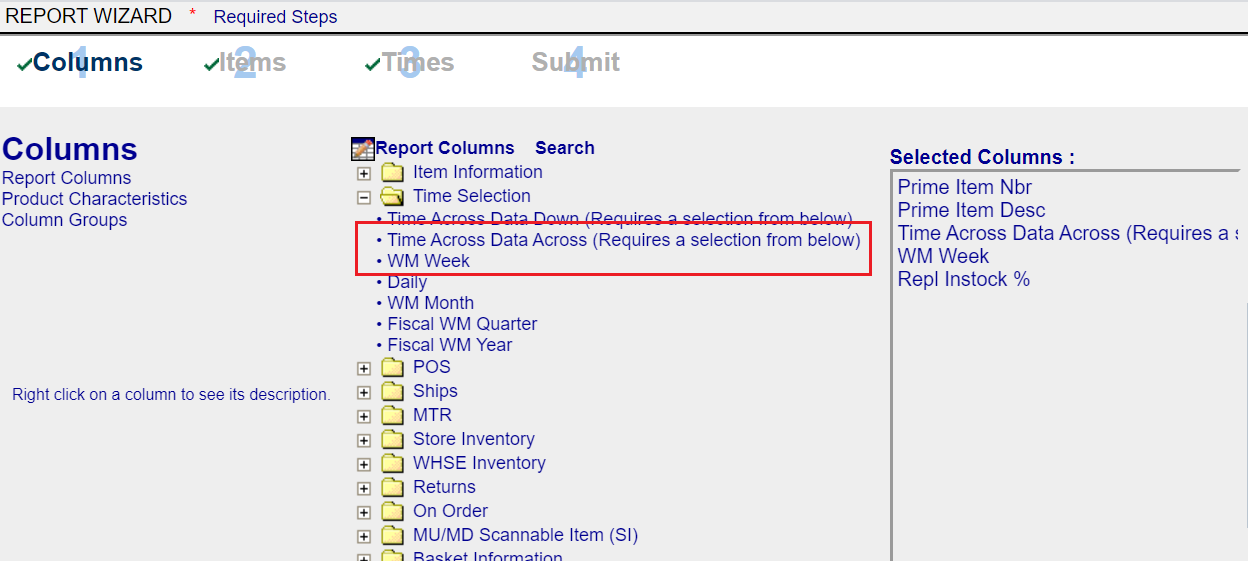
DSS Report Wizard – Columns tab for historic instocks
For our purposes, you can make the same selections in the Items tab as in the last report.

DSS Report Wizard – Items tab for historic instocks
Columns to select:
- Prime Item Nbr
- Prime Item Desc
- Time Across Data Across
- WM Week
- Repl Instock %
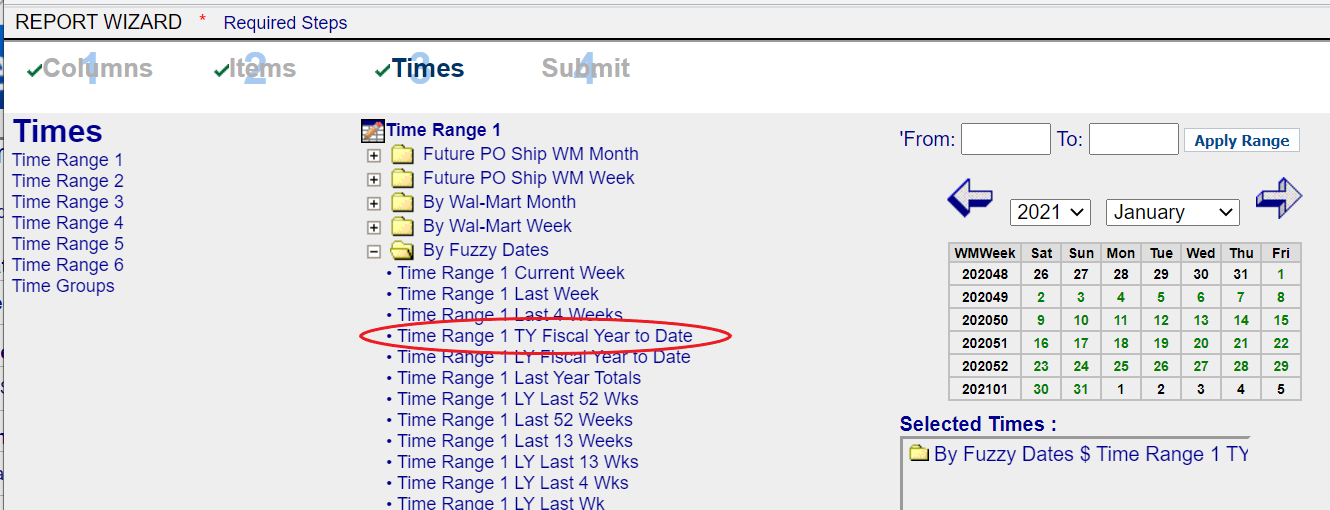
The Times tab is where you will define the time range for this report (i.e. last four weeks, year to date, etc). This is different from the time increment we defined on the Columns tab, which instructed DSS how many “slices” to divide our time range into.
For instance, our report is requesting instock data for the current fiscal year to date, in weekly increments. So, if we were 15 weeks into the current fiscal year, the report would display an instock datapoint for each of the 15 weeks.
Use the following screenshot as a guide for the Times tab selections.
DSS Report Wizard – Times tab for historic instocks
For the purposes of this report, select:
- By Fuzzy Dates
- Time Range 1 TY Fiscal Year to Date
On the Submit tab, name, run, save and schedule (optional) this report query.
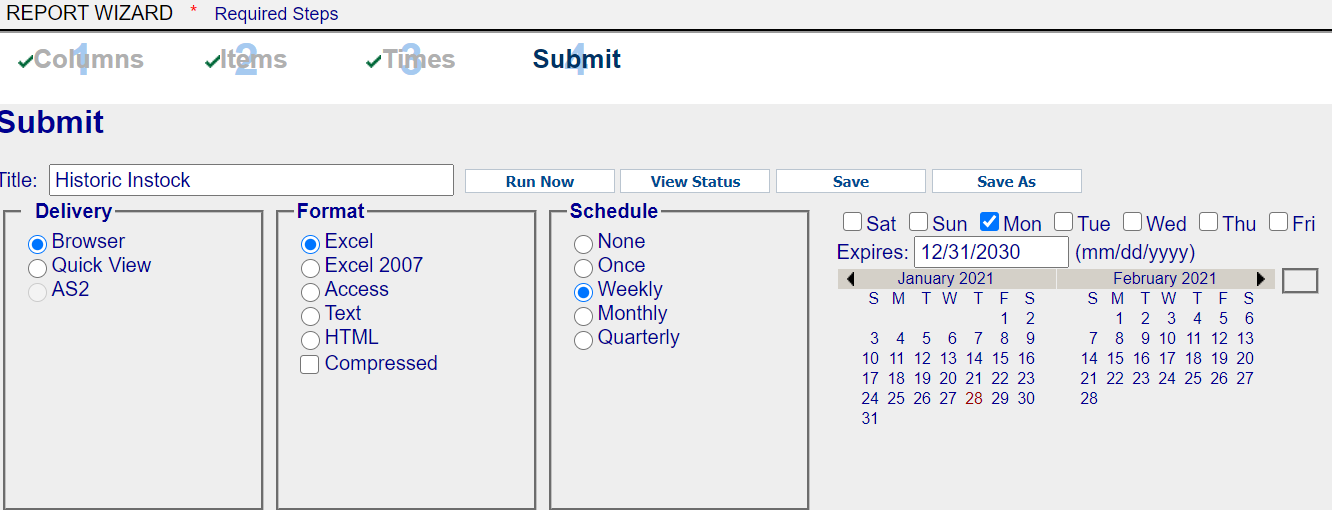
DSS Report Wizard – Submit tab for historic instocks
The Results of the Historic Instock Report
Once downloaded, the Excel sheet should look similar to the screenshot below. You’ll notice that there are many more columns in this report. Remember, we are asking for historical instock by week. Therefore, the resulting columns display the instock for each historical week within our chosen time range.
The report associates the numbers presented in the column headings with the year and week, in Walmart’s YYYYWW format. For example, a column heading of “202015 Repl Instock %” means that the data in this column is the replenishment instock percentage for this item during Week 15 of 2020.
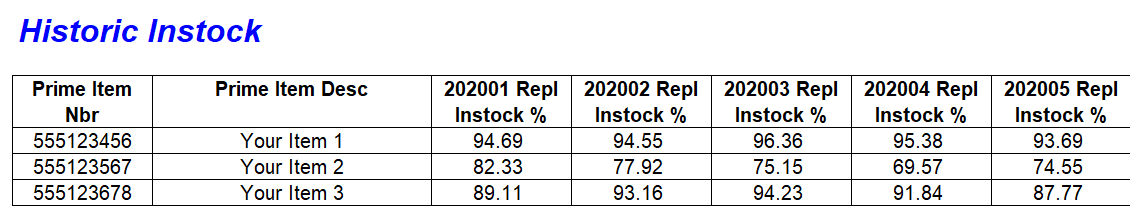
Historic Instock – Excel report
In Summary
You now have two powerful DSS queries in your analytics arsenal: current instock position as well as historical instock trends. Instock is of utmost importance to your success with Walmart, and these reports will help you identify and potential liabilities.
Get valuable, actionable insights for your Walmart business. Get started!
Related Resources
Written by Tim Carey
About Tim Carey
Tim has been in the Walmart supplier community for over 15 years. His expertise is in Consulting, Business Analytics, and Retail Link for Walmart suppliers.
Read More
About

Established in 2007, Trend Results is a full-service Consulting, Business Intelligence, and Retail Link Training firm specializing in Walmart suppliers throughout the United States and Canada.
Our team consists of former Walmart suppliers and retail professionals with over 16 years of combined experience calling on Walmart and Sam's Club.
View Trend Results's Website