Walmart Sales Analytics – Inside the Insights
In the world of retail, sales is king. Therefore, each retailer tends to use similar sales metrics with a few exceptions. Walmart, as the world’s largest retailer by revenue, uses some of the most well-known sales measurements. Those new to retail metrics may not know what critical sales or metrics are or why they are so critical for Walmart sales analytics.
Firstly, retailers measure revenue at the point-of-sale (hereafter POS, or register). Walmart records this data as POS Sales and POS Quantity. These metrics represent the sum of dollars sold at the register and the sum of units sold at the register, respectively. Necessarily, these metrics inform every part of Walmart sales analytics- from the simple to the advanced.
However, when performing Walmart sales analytics, sales aren’t only measured by their performance in a single range of time. Most of the time, they are compared on a year-over-year basis. An analyst will compare a 13-week period to that same period in the previous year. They look at the difference in the two periods in terms of raw dollars or units as well as percent change over the period. The percent change is often more valuable because it has a contextual impact. 13,500 units in sales growth are not as helpful as framing that unit growth as 7.5% growth year-over-year.
Seasonal sales analysis can also create wrinkles in a year-over-year analysis. After all, key holidays like Independence Day, Thanksgiving, and Christmas can all fall in different fiscal weeks year to year. This is where dynamic year-over-year tools like those provided by SupplyPike’s Sales Comparison come in handy. It allows comparison of ranges that are not year-over-year equivalents. This greatly aids seasonal and promotional year-over-year analysis, which is a critical aspect of Walmart sales analytics.
Related Reading: How to Move Beyond Spreadsheets
Sales Velocity and Walmart Sales Analytics
Sales velocity is a great example of an advanced sales metric under the umbrella of Walmart sales analytics. Topline sales numbers are great to establish a baseline and begin a presentation or executive summary with.
However, advanced sales metrics add critical context. Sales velocity breaks down sales and can give an average rate of sale per-store per-week. These measures are known as Units per-Store per-Week (USW) and Dollars per-Store per-Week ($SW). Dividing the number of dollar sales or units by the number of stores valid for replenishment and then further by the number of weeks over the measured period generates these metrics.
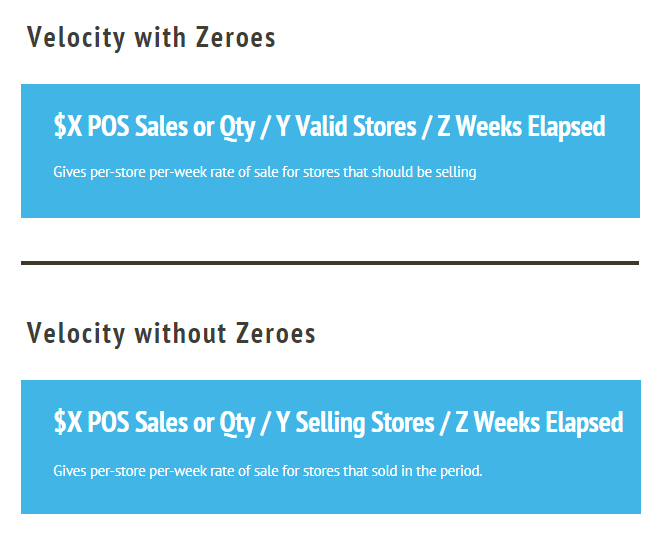
However, in Walmart sales analytics, these are not the only velocity measures. Retailers also measure sales velocity “without zeroes.” Rather than dividing by valid stores, those metrics divide by selling stores. Both the “with zeroes” and “without zeroes” metrics have their uses. “With zeroes” provides an unbiased and complete look at per-store per-week performance for every store that should be selling. In contrast, “without zeroes” communicates per-store per-week performance in stores that are selling. So if an item has a high overall selling velocity and a much lower overall valid velocity, it is not selling where it should be. This could be an indication of localized replenishment issues. Overall, sales velocity is an interesting way to contextualize sales data.
Ships and Sales
Ship data can also help contextualize Walmart sales analytics. Specifically, Walmart publishes this data as Net Ship Quantity. In Walmart terminology, Net Ship Quantity simply refers to Ship Quantity minus Returns. Analysts often chart net ships and sales over time to show opportunities. Ideally, these two metrics should come close to equaling each other weekly. This shows that ships are evenly replenishing inventory that is being sold. However, there will be exceptions for things like modular, seasonal, and promotional orders.
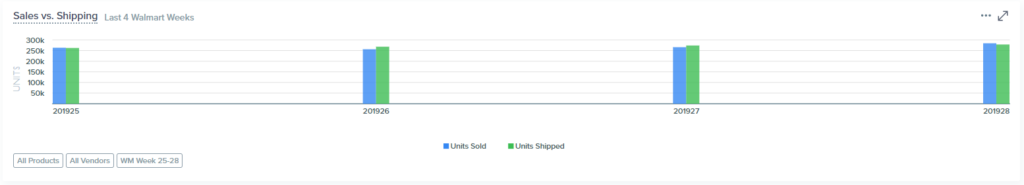
This image is a good example of a healthy relationship between sales and ships over time.
In contrast, uneven sales and ships distribution over time can reflect issues in the supply chain. For example, say Walmart is under-forecasting an item or ordering less than their supply plan. Or imagine there is a manufacturing problem that impacts supply. Sales will exceed ships until there is a large spike in ships necessitated by the inventory consumption.
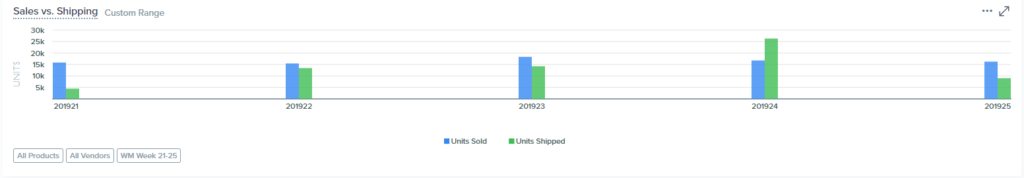
In this example, from week 23 to week 25, sales exceeded ships. This created the need for a large shipment in week 26.
All analysts can take sales for granted. The topline sales dollars and units rarely tell a full story. Actionable insights come from taking the basic sales data and applying key context. Sales velocity and ship data are two such data sources. SupplyPike’s platform provides this necessary context with engaging visualizations. Reach out today to see what SupplyPike has to offer to help you take your Walmart sales analytics to the next level!
Get valuable, actionable insights. Get started!
Related Resources
Written by The SupplyPike Team
About The SupplyPike Team
SupplyPike builds software to help retail suppliers fight deductions, meet compliance standards, and dig down to root cause issues in their supply chain.
Read More
About

SupplyPike helps you fight deductions, increase in-stocks, and meet OTIF goals in the built-for-you platform, powered by machine learning.
View SupplyPike's Website