Measuring On-Shelf Availability
Learn about:
- Measuring on-shelf availability
- New technologies for measuring OSA
Shoppers visit stores to get the products they require. If these products are not available on the shelves, 12% of surveyed consumers stated they would make a beeline for a competitor’s product to cover their needs, while 32% said they would leave without buying anything. In either case, it’s a loss for all those involved: the supplier, the retailer, and the consumer.
Scarce on-shelf availability (OSA) and consistent out-of-stock (OOS) events greatly influence retail behavior. Conventional approaches of OSA management are no match for current technology that can report live tracking of shelf space.
Why do current measurement methods fail?
Not having visibility into on-shelf activities can cause problems with measuring OSA. The modern measurement methods are just not successful in providing real-time and comprehensive data critical for quality decision-making and remedial measures around OSA.
-
Manually checking inventory is the baseline method for maintaining OSA. However, physically counting all items in stock and comparing that number to what is in the database is costly and not easy to measure. Also, manual store checks are highly vulnerable to human-caused error, take considerable time, and fail to scale sales loss.
Physical audits do not differentiate between OOS situations caused by, say, theft versus high sales. Retailers must often perform these inventory counts, typically during restocking, and compare OOS rates with loss prevention reports and point-of-sale data.
-
Inventory systems make it possible to track sales promptly. Inside Walmart’s Retail Link, suppliers can view how many units they have on-hand in-store, which should help determine if an item is out of stock. However, this analysis can lead to a phenomenon known as phantom inventory, where the inventory system will say that there are items in stock. Yet, a SKU will go weeks on end without being in a single store. Phantom inventory is typically a good indication that an item is out of stock, and suppliers need to call the store manager to check to see if an item is, in fact, on the shelves or in the back by doing a manual check.
Inventory systems’ failure to provide on-hand precision continues to be a big challenge. One study by the Auburn University RFID Lab showed that the average U.S. inventory accuracy rate is only 60%. Most of this is due to inaccurate tracking of sold items, theft, and untracked breakage.
-
Point-of-sale (POS) data assesses OOS rates according to historic sales. This data doesn’t always work for SKUs that are slow to sell, such as non-consumables like furniture. The accuracy level of POS data is similar to manual audits, at times, even lower.
Additionally, suppliers can only assess POS data at a consolidated scale, and not individual store counts. This assessment does not allow evaluation at a granular level.
Because all of these conventional techniques have their shortcomings, suppliers and retailers need to leave aside proxy sources and look for better avenues for monitoring real-time store scenarios.
New technologies reduce out-of-stocks
With image recognition (IR), suppliers and retailers can access specific shelf data digitally by scanning through the store. IR solutions capture the images of products on retail shelves in real-time. These images then undergo processing and analyses resulting in significant in-depth knowledge of OOS rates, product availability, stock activities, and conformity. This technique provides unhindered access to in-the-moment data for every SKU in the store. This method offers suppliers advance notice of an OOS event or when there is a possibility of a compliance issue.
Correctly determining and measuring OSA by acquiring a shopper’s perspective of the shelf is essential for maintaining sales. A study done by Quri found that OSA levels lowered by up to 50 percentage points just after Memorial Day and Fourth of July store promotions. Moreover, according to the data, “inadequate monitoring strategies” sunk OSA levels lower than the recommended 98% rate by as much as 20 percentage points.
A 2% fall in OSA, by and large, creates a 1% loss of sales, according to PointOfSale.com. Maintaining healthy levels of OSA is a must, especially for seasonal items, to better understand the return-on-investment for these products during their peak. With timely reporting indicating what shoppers see on the shelf, prominent retailers are increasing their OSA levels on a per-store basis by fixing routine stocking problems and evaluating forecasting issues.
Retailers such as Target and Walmart have a better chance of implementing brand-specific promotion plans to predict ROI better. Brands with more in-store visibility generally see greater profits from promotions.
The first step to making the most from each shelf’s value in every store is ensuring over 98% on-shelf-availability at all times. Retailers and suppliers may accomplish this goal through image recognition technology in conjunction with physical store audits, inventory systems, and point-of-sale data.
Predict out-of-stocks accurately
Retail Intelligence by SupplyPike allows you to predict out-of-stocks at individual stores by analyzing your on-hand inventory daily. View your weeks of supply, store on hand, store on order, and store in transit. Get up-to-the-minute instock percentages. View maps showing locations of low stocks.
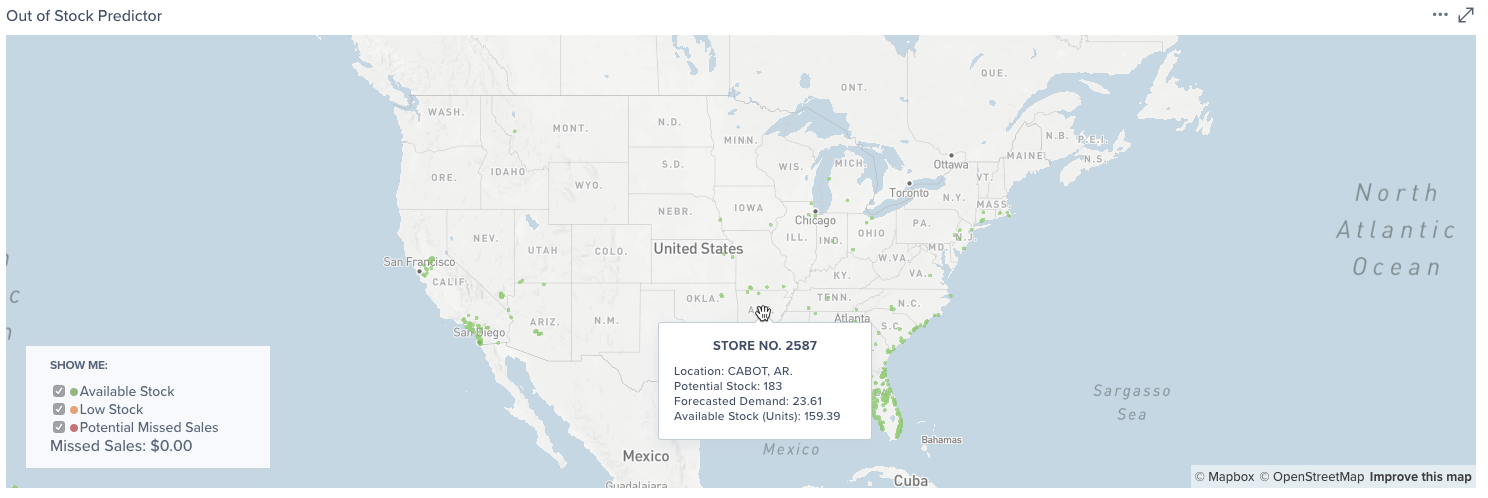
Retail Intelligence - Out of Stock Predictor Map
Get started today with your free 14-day trial!

Related Resources
Written by The SupplyPike Team
About The SupplyPike Team
SupplyPike builds software to help retail suppliers fight deductions, meet compliance standards, and dig down to root cause issues in their supply chain.
Read More
About

SupplyPike helps you fight deductions, increase in-stocks, and meet OTIF goals in the built-for-you platform, powered by machine learning.
View SupplyPike's Website