How Do I Do Segmentation Analysis in Retail Link?
Learn about:
- The basics of segmentation analysis
- How to perform segmentation analysis in Retail Link
- Analyzing the Retail Link Excel report
Imagine this scenario. You are reviewing your supply chain data and notice that an item has low instock levels and high weeks of supply. How can this be possible? How can an item be out of stock and overstocked at the same time?
You can find the answer at the store level with a “segmentation analysis” that can quickly identify the details of such an anomaly.
The basics of segmentation analysis
Think of a segmentation analysis as a compromise between analyzing an item at the item-level versus store-level. Instead, this analysis divides your store data into distinct groups or segments. A typical scenario is to divide stores into groups of ten percent each. By analyzing each segment, you can identify microtrends much more quickly than drilling down to individual store-level.
Segmentation analysis is ideal for determining groups of stores that are outperforming the average, underperforming stores, and any potential inventory imbalances. Once you’ve identified these segments, you can capitalize or improve upon each segment’s performance.
As you might have guessed, we need to gather some store-level data from Retail Link to group stores into segments. The metrics we will be looking at in this example are sales, store inventory, and forecast data. However, you can use this same analysis to analyze other metrics like sell-thru, markdowns, customer returns, or any metrics at the store-level.
Building the segmentation analysis in Decision Support
Below are the screenshots detailing the necessary steps to build the store-level report. Keep in mind that you must perform this analysis on one item at a time. This is partly due to the sheer volume of data you are gathering and because you are typically doing a segmentation analysis based on some insight gained for a specific item at the item-level.
From the Decision Support homepage in Retail Link, select Sales and Margin from the list of Report Templates. Open the template called Store Detail. The resulting template should look like the following screenshot.

Retail Link – Store Detail report template
Columns Tab – Select the following report columns:
- Prime Item Nbr
- Prime Item Desc
- Store Nbr
- City
- State
- POS Qty
- Curr Str On Hand Qty
- From the Store Weekly Forecast tab:
- Select the future 17 weeks

Retail Link – Store Detail Columns tab
Items Tab – From the left menu, select Filters. In the list of folders, scroll down and open the folder titled “Item Nbr.” In the input box on the right, enter the 9-digit item number you are investigating and click the AND button.

Retail Link – Store Detail Items tab
Locations Tab – Select Stores from the left menu, then open the folder names “Store Type Breakdown” and click “All Stores (Without Dotcom).”

Retail Link – Store Detail Locations tab
Times Tab – From the left menu, select Time Range 1. Open the folder titled “By Fuzzy Dates,” then click on “Time Range 1 Last 4 Weeks”.

Retail Link – Store Detail Times tab
Submit Tab – Like all Decision Support report templates, the Submit tab is where you can title, name, schedule, and save the segmentation analysis. By saving this template, you can always return to My Reports and simply change the item number to run the same analysis for a different Walmart item.

Retail Link – Store Detail Submit tab
Segmentation analysis results
A partial screenshot of the results is below. The report lists each store along with the chosen metrics: sales, inventory, and forecast. However, this data is by store, not by segment. We will still need to do some data reduction to see this data by segment.

Retail Link – Segmentation Analysis in Excel
There are multiple data reduction techniques to accomplish the same result. We aren’t going to concentrate on specific Excel formulas in this lesson. Instead, we will discuss the conceptual data reduction and what each step accomplishes.
In short, the ultimate goal of the segmentation analysis is to group this store-level data into distinct segments. Typically, each segment contains ten percent of the total store count. To accomplish this, we will need to add a few formulas and do some sorting, subtotaling, and a few other simple Excel tasks.
Step 1: Sort by point-of-sale (POS) quantity
By sorting this entire table by point-of-sale (POS) quantity in descending order, we will see the highest-selling stores first and lowest-selling stores last. Simply highlight the whole table and sort by the column “POS Qty” in descending order.

Excel – Sort by POS Qty in descending order
Step 2: Calculate the total store count and create segments
To determine how many stores will be in each segment, we need to find the total number of stores into which this item is selling. Using the COUNT() function in Excel, add a field to determine the total store count for this item.

Excel – Calculate the total number of stores in this dataset
In this example, our item is selling in 3,209 stores. Since we are looking to divide this total store count into ten distinct segments, we can determine that each segment will have roughly 321 stores.
We have sorted this dataset by top-to-bottom selling stores, so the first 321 stores in this dataset represent the top-selling 10% of all stores into which this item sells. Similarly, the following 321 stores would represent the 10-20% store sales ranking.
By subtotaling each segment, we can determine the total sales, total inventory, and total forecast for each segment. There are many ways to accomplish this in Excel, so we won’t get into each method’s specifics.
Below is a screenshot of the dataset, divided into ten segments:

Excel – Group data by segments
You might have noticed the highlighted columns that we added to the dataset. The purpose of these columns is to see each segment’s contribution to the total for the various metrics.
For example, Segment 1, which represents the top 10% of store sales, makes up 26.6% of this item’s total sales. However, it only has 11.8% of the total inventory, and the forecast is 29% under in the past four weeks.
Conversely, Segment 10, which represents the bottom 10% of store sales, makes up roughly 0% of store sales. However, this segment has 7.4% of the total store inventory and forecast that is 100% over.
This asymmetrical distribution suggests a classic inventory imbalance. Remember the original scenario where this item had low instock but high weeks of supply at item level? Here is how this data shows why:
- The top segment makes up 26% of store sales but only has 11% of the total inventory. This discrepancy would likely explain the low instocks at the item level.
- The bottom segment has 0% of the sales but 7% of the inventory. This is dead inventory and accounts for the high weeks of supply at the item level.
If we were able to work with the Replenishment Manager on forecast adjustments, we could likely align the inventory distribution to correlate with the sales distribution by segment. In other words, Segment 1 should have 26% of totals sales and roughly the same percentage of the total store inventory.
In summary
There are many different ways to perform the data reduction in Excel. Just keep in mind the end goal, which is to see each segment’s contribution to the total and hopefully identify both root-cause and growth opportunities.
Ditch the spreadsheets
With SupplyPike’s Retail Intelligence, you can perform in-depth analysis without messy spreadsheets. Use the Quartile Report to analyze sales down to the item and store level.
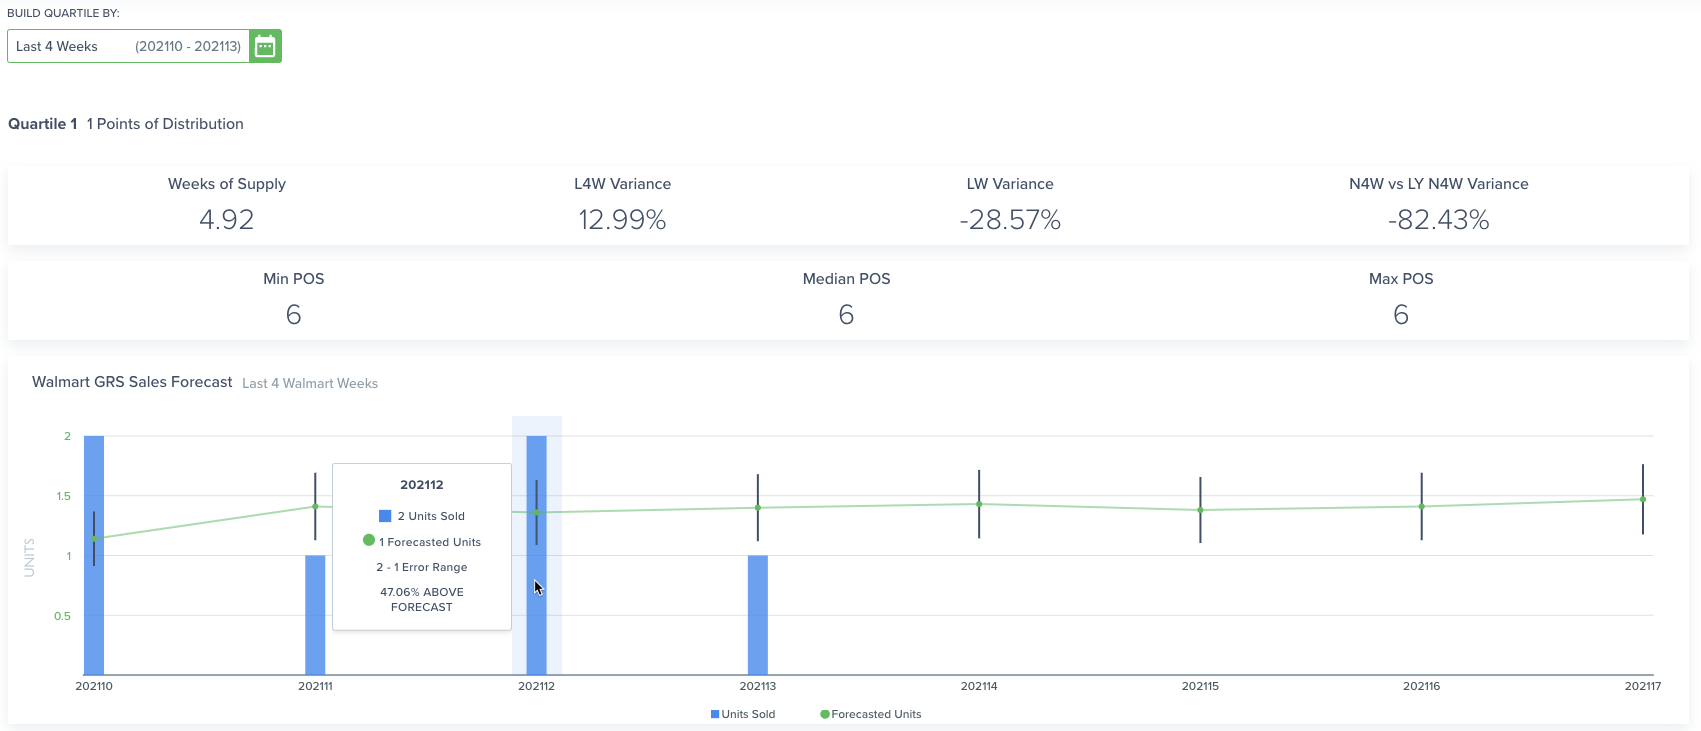
SupplyPike Retail Intelligence – Quartile Report
Get updates in your activity feed when there are stores below the sales threshold.

SupplyPike Activity Feed – Stores Below Sales Threshold
Get started today to analyze your data and find pain points. Try it for free!

Related Resources
Written by Tim Carey
About Tim Carey
Tim has been in the Walmart supplier community for over 15 years. His expertise is in Consulting, Business Analytics, and Retail Link for Walmart suppliers.
Read More
About

Established in 2007, Trend Results is a full-service Consulting, Business Intelligence, and Retail Link Training firm specializing in Walmart suppliers throughout the United States and Canada.
Our team consists of former Walmart suppliers and retail professionals with over 16 years of combined experience calling on Walmart and Sam's Club.
View Trend Results's Website