GMROII: Combining Sales, Profitability, and Asset Efficiency
Learn about:
- Tracking sales performance
- Measuring profitability
- Determining asset efficiency
If you are reading this, you are likely already familiar with Walmart’s supplier portal, Retail Link, as well as the Decision Support System (DSS). What you might not be familiar with, however, is what Walmart expects from its suppliers and which insights can empower you to make the most of your Walmart business.
Walmart suppliers should be familiar with the concept of Gross Margin Return on Inventory Investment (GMROII), which helps suppliers generate more interest in their products. In this article, we detail how to measure GMROII in Retail Link using DSS.
Sales, profitability, and asset efficiency
In the retail world, there are three separate key performance indicators (KPIs):
- Sales
- Profitability
- Asset efficiency
Each metric involves several more minor metrics. However, since these metrics all feed into the same primary KPI and are all available on one Decision Support report, we are going to combine them into the first metric.
The first report all Walmart suppliers should be reviewing every week is the Supplier Performance Scorecard. This scorecard is a “same page thinking” document, highlighting all of the metrics that Walmart considers on the way to arriving at its ultimate performance indicator. The result of sales, profitability, and asset efficiency metrics is the Gross Margin Return on Inventory Investment or GMROII.
In its simplest form, GMROII is an indicator of how much money Walmart made, in gross margin dollars, for every dollar of a supplier’s inventory that Walmart owned at cost. GMROII combines sales volume, profitability, and asset efficiency. Let’s discuss each metric briefly and how they work together to arrive at your GMROII score.
Sales volume
The easiest to quantify, sales volume, is simply the total dollar sales to the Walmart consumer. This metric is not the supplier’s sales to Walmart; it is the register sales at Walmart stores.
Using Decision Support (or another retail analytics app), suppliers can measure their sales volume in reports as Year-over-Year or Week-over-Week. Suppliers may look at sales reports using fiscal years or calendar years.
Suppliers can use DSS to drill down into their vendor numbers. They can also compare online sales and in-store sales.
Profitability
Several different metrics fall into the category of profitability. The two most important are Initial Margin percentage and Maintain Margin percentage.
- Initial Margin percentage is simply the amount that Walmart raises the price above the unit cost. The formula is (Retail - Cost) / Retail expressed as a percentage. Think of this as Walmart’s potential margin.
Initial Margin % = [ ( Retail - Cost) / Retail ] x 100
- Maintain Margin percentage is arguably the most important profitability metric. This metric considers the impact of markdowns on the initial margin. The formula gets a bit complicated, but in essence, you can think of Maintain Margin percentage as_ the margin remaining after markdowns_. In other words, how much did Walmart actually receive from the consumer when the consumer purchased the supplier’s products. Maintain Margin is in the profitability portion of the GMROII calculation.
Asset efficiency
Asset efficiency is often the most elusive metric for suppliers to conceptualize. Several metrics fall into the category of asset efficiency. Essentially, these metrics tell Walmart how efficiently Walmart is handling its assets (i.e., the supplier’s inventory).
This metric requires an ideal balance of inventory – not too much, not too little. Walmart strives to keep its shelves full, so it monitors a metric known as Replenishment Instock percentage. However, it also seeks to keep inventory costs down by monitoring metrics like Weeks of Supply and Unit Turns.
- Replenishment Instock % measures the number of stores that have sufficient inventory on hand to cover the daily forecasted demand. It doesn’t mean that if a store has one unit on hand, it is necessarily considered instock. If that same store has one unit on hand, yet the forecast for that day is to sell four units, then that store is effectively out of stock.
- Weeks of Supply is a measurement of the estimated number of weeks that the existing store inventory will last. Suppliers use this metric, which can help identify excess inventory, as a balance point alongside Replenishment Instock %, which determines if Walmart has enough stock. Suppliers determine weeks of supply by using historical sales or future sales forecasts.
- Unit Turns is a ratio of sales to average inventory. It identifies how fast Walmart is turning a purchase of the supplier’s stock into a sale to the consumer. Unit Turns is easier to describe with real numbers. For example, if a supplier’s item sold 10,000 units to Walmart in a fiscal year, and the average inventory maintained at store level was 12,500 units, the unit turns would be 0.8.
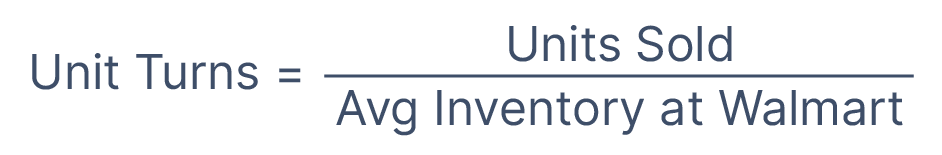
Unit Turns = Units Sold / Average Inventory at Walmart
Conclusion
The three metrics discussed above – sales, profitability, and asset efficiency – work together to form GMROII. Since GMROII combines these three metrics, it allows Walmart to identify items that might, for instance, have higher sales volume, but the sales might have occurred at a lower profit margin or less efficiently. For this reason, it is imperative that Walmart suppliers go well beyond simply reporting on product sales, concentrating on the end results of all of their efforts: GMROII.
Viewing metrics with ease
Using SupplyPike’s Retail Intelligence app, you can quickly view your GMROII metrics via dashboards with actionable insights.
Measure sales volume using the Sales Comparison metric:
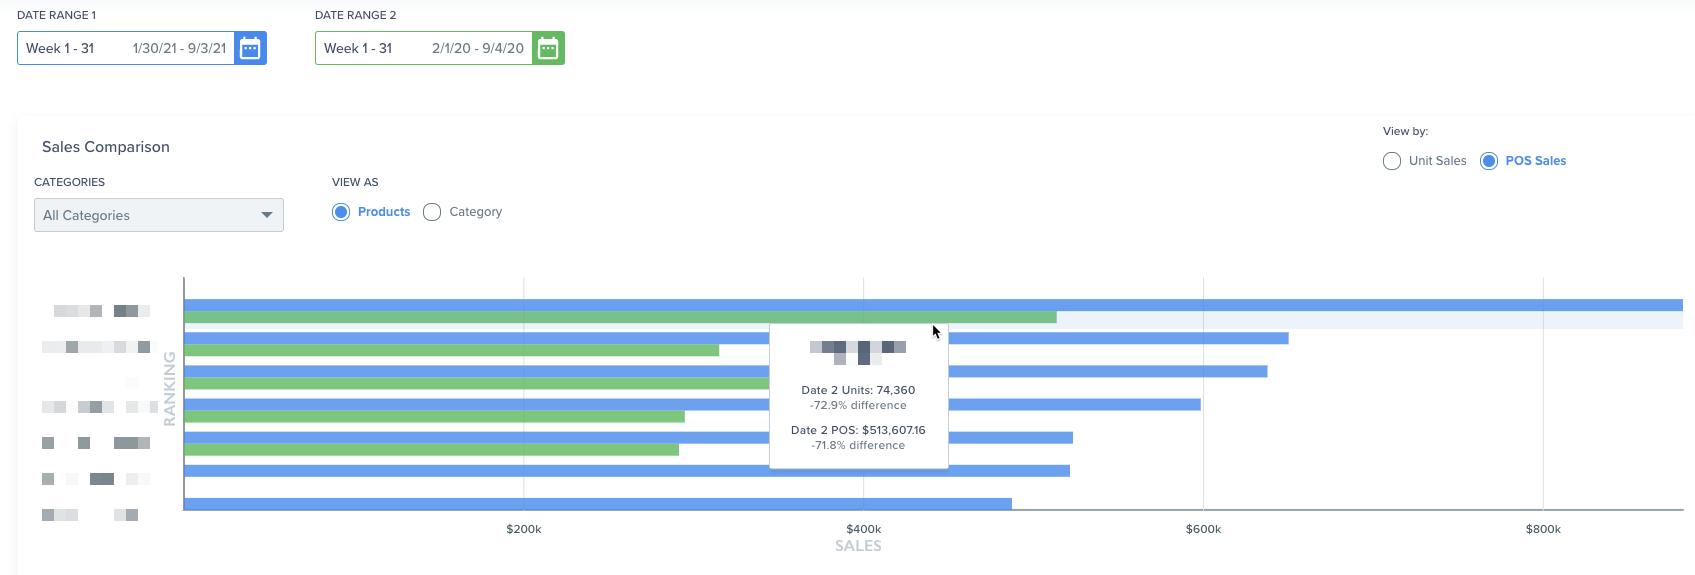
Retail Intelligence – Sales Comparison
Measure profitability using the Performance Report metric:
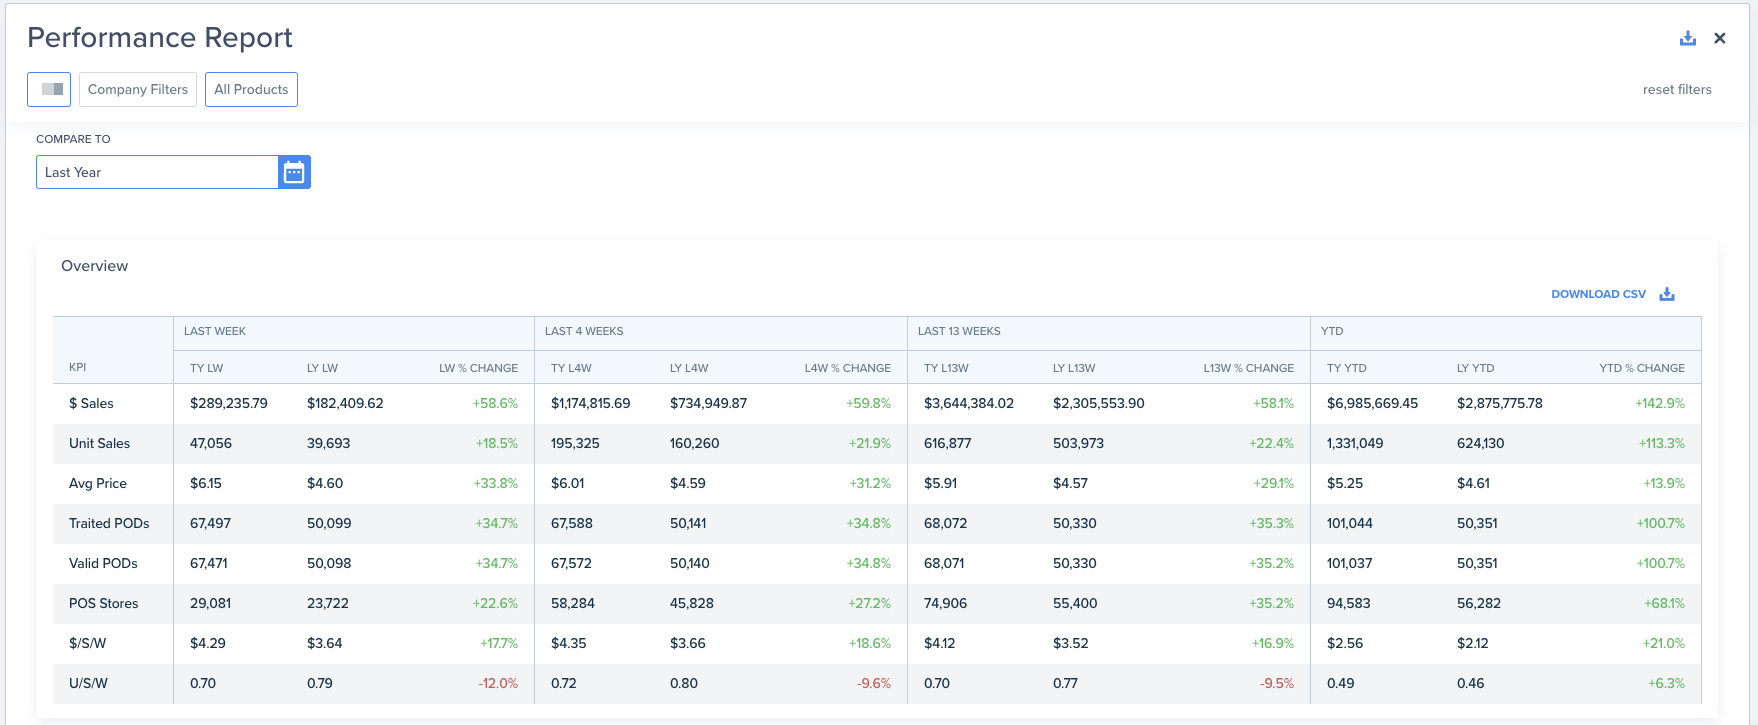
Retail Intelligence – Performance Report
View your assets’ efficiency using the Walmart Inventory metric:
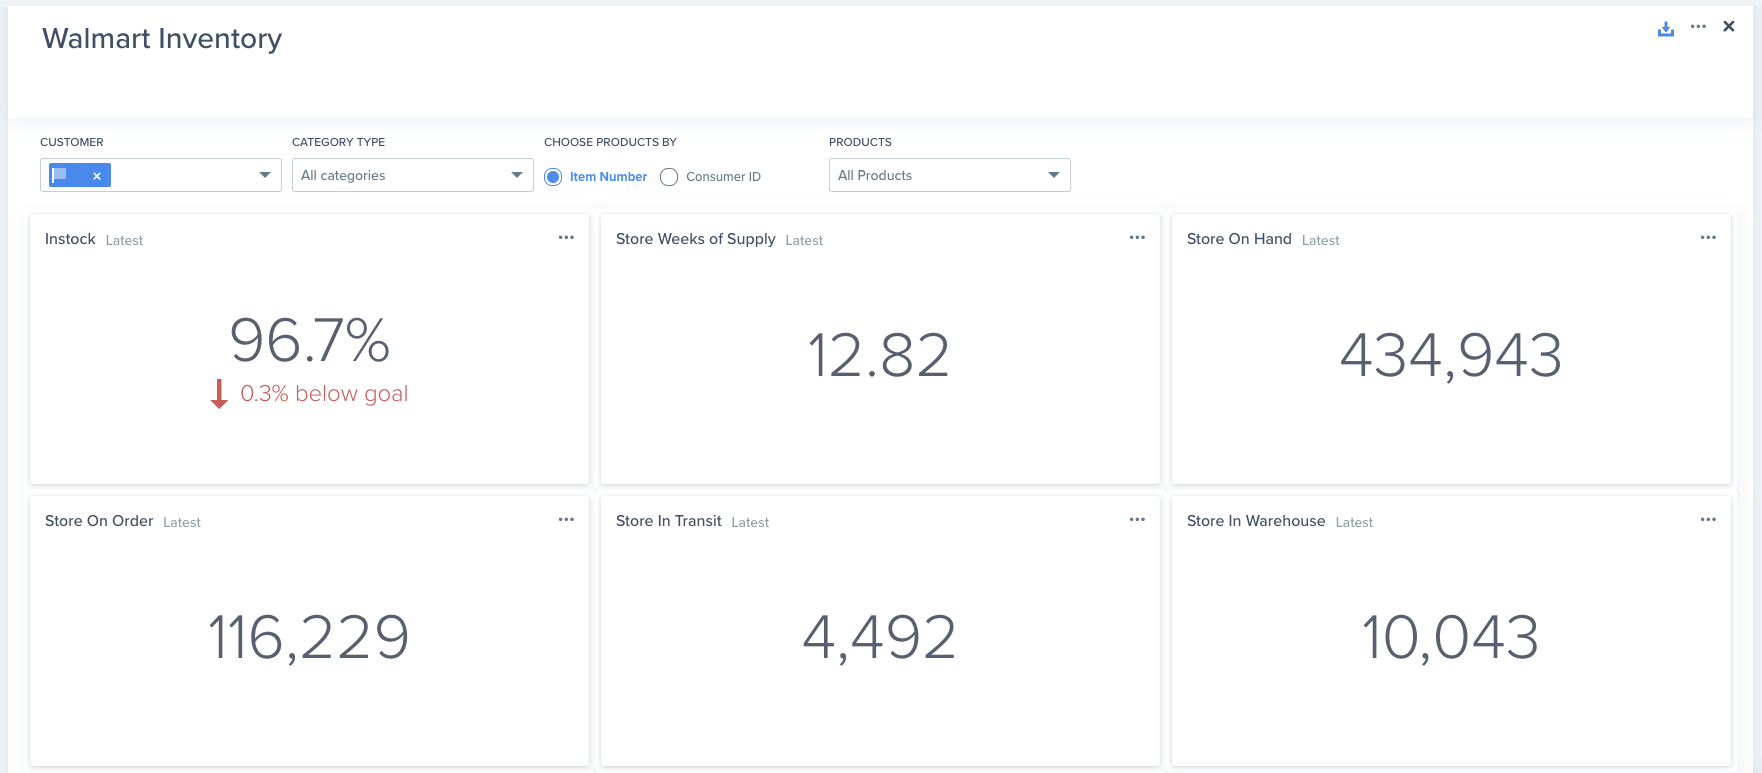
Retail Intelligence – Walmart Inventory
See your data in action for free today!

Related Resources
Written by Tim Carey
About Tim Carey
Tim has been in the Walmart supplier community for over 15 years. His expertise is in Consulting, Business Analytics, and Retail Link for Walmart suppliers.
Read More
About

Established in 2007, Trend Results is a full-service Consulting, Business Intelligence, and Retail Link Training firm specializing in Walmart suppliers throughout the United States and Canada.
Our team consists of former Walmart suppliers and retail professionals with over 16 years of combined experience calling on Walmart and Sam's Club.
View Trend Results's Website